
Click Here for a 4Q 2024 performance update and more about our model portfolios
The Cedar Portfolio and the CedarOwl Portfolio

Our Portfolios
We have two portfolios:
The Cedar Portfolio - our full portfolio of great businesses from around the world, qualified through our investment process.
The CedarOwl Portfolio - a subset of the full portfolio called the CedarOwl Portfolio, emphasizing income generation through dividend-paying equities.
Here are the performance statistics for the full Cedar Portfolio:
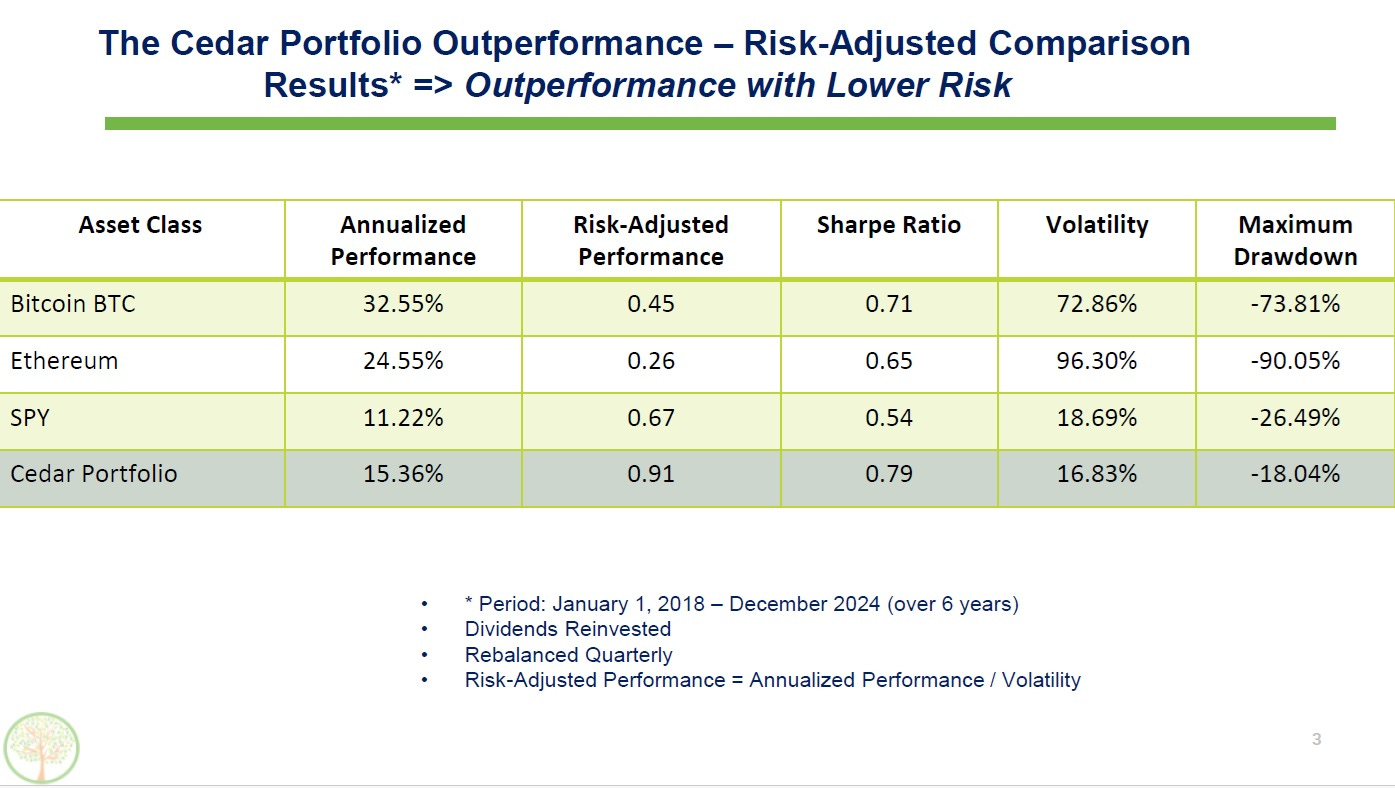
Targeting Risk-Adjusted Outperformance
Our focus is on targeting risk-adjusted outperformance - meaning good performance at lower overall risk relative to benchmarks.
Note on the above performance chart the outperformance results on a risk-adjusted basis, relative to Bitcoin and Ethereum cryptocurrencies, the S&P 500 index and one of the biggest ESG ETFs in the world - SUSA. Outperformance has been better on the basis of:
outperformance on Risk-Adjusted Performance (defined above)
outperformance on better Sharpe Ratio risk metric
outperformance on lower Volatility risk metric
outperformance on lower Maximum Drawdown
The period of time is a combination of actual performance results from November 2020 when the Cedar Portfolio index was launched with back testing results to January 2018.
The full Cedar Portfolio is rebalanced with adjustments - holdings added or removed, holding weightings changed - on a quarterly basis.
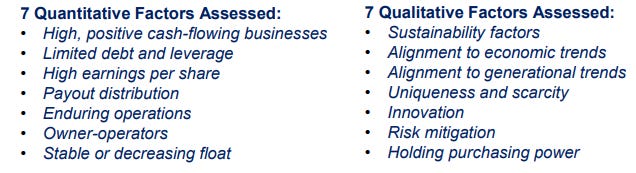
Our Investment Strategy and Approach
Our investment strategy for targeting outperformance puts emphasis on analyzing seven (7) quantitative factors and seven (7) qualitative factors that are based on the principles of the Austrian School of Economics. Each of the quantitative factors have associated studies indicating a correlation of equity outperformance - therefore we look to qualifying equities of great businesses that can meet as many of these seven quantitative factors as possible, thus providing an additive probabilistic edge toward overall portfolio outperformance.
Here is the full and complete portfolio …